- Synopsis
- Study Material
- Concept Refresher
- More Material


Additional Resources for Better Results
Charts, Tables & Diagrams
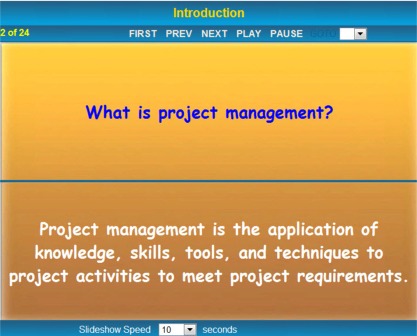
The purpose of charts is normally to make understanding information simpler. Flow charts are easy-to-understand diagrams showing how steps in a process fit together. This makes them useful tools for understanding the relationship between the input and outputs of each PMP® processes. Furthermore, the act of mapping a process out in flow chart format helps you clarify your understanding of the process.Our portal has more than 70 charts which are derived from PMBOK® Guide and PMP® Study material for conceptual understanding. These charts can be navigated by knowledge Areas, process Groups or by name.
Charts: Various bar and line charts to represent relationship between 2 or more project management items of Cost, Quality and Human Resources Management.
Data Flow Diagrams: These diagrams are to represent PMP® process inputs and outputs for all 47 Project Management processes.
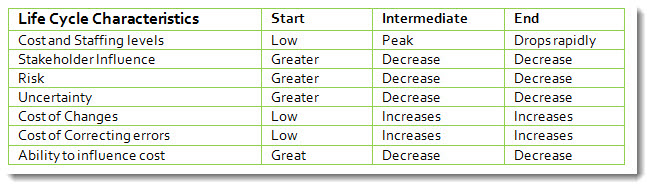
Tables: Organizational influences, RAM Chart, RACI chart, Stakeholder Register, Risk Register and some other diagrams are represented as a table.
Project Management Case Studies
Project Management case studies will help in understanding project management concepts by relating them to practical situations.
Case studies can be reviews for all project management knowledge areas like, scope, time, cost etc,.
Tutor Conflux has a case study on Project Cost Management called Cost Complications. We ask our participants to study this case study before the class starts and our instructor will discuss the same during the class.
Project Management Templates
Tutor Conflux has more than 30 project management templates to understand real project documentation. These templates were created based on real work projects. We also have PMP® Application templates to help the participants during the application submission process.
I T T O s Chart
Inputs, Outputs and tools & techniques are shown in graphical representation. Tutor Conflux Members will have access to all 10 knowledge area charts and tips to memorize them conceptually.
Review Results
Review results is a great tool for the students to review and compare their test results. This will help to evaluate the progress and explains strengths and weaknesses.
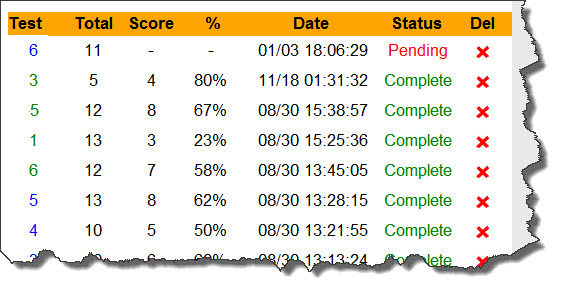
Total : Total Number of questions.
Score: No of questions answered Correctly,
Note: this will not display for incomplete tests.
Per: Percentage gained
Del: You can delete the test from your review page by clicking on X mark.
This has more functionality to show completed and pending tests.
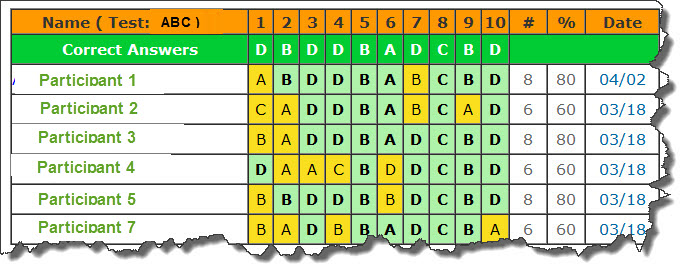
Verify Results
Verify results is the tool to use during the class. Only Instructor has access to this page and he will review and compare the results of the participants. Instructor will discuss the questions in the class which more people not answered correctly.
Assignments
During the course we send out the assignments for most important chapters. By the end of the course we send around 15 assignments. We follow up to make sure everyone responds to the assignments. We send back the answers with explanation.
Look ahead-Scenarios that you may confront in future
Our instructors discuss some scenarios with real world examples during the class. We display questions pertaining to the situation given by us, ask the participants to discuss and gather their opinions on this discussion. We then share the answers with explanation. These scenarios are based on the PMP® situational questions.
Group Discussions and Forums
During the class training we give some topic to the participants to discuss among them. We also create an email discussion form which will help the participants post their questions, suggestions and get the responses from other participants as well as the tutor conflux support team.